


- Home
- Products
- Temperature Data Loggers / Recorders
- Freezer & Refrigerator Temperature Monitoring System
- Temperature Monitoring System for Cold Room, Walk in Chillers, Warehouses
- Shipping / Cold Chain Monitoring
- Multichannel data loggers by MSR Switzerland
- Desiccant & Condensation Dehumidifiers
- Dehumidifier Capacity Calculation
- Portable Desiccant Industrial Dehumidifiers for Cold Room
- Marine dehumidifier
- Desiccant dehumidifier Stationary
- Condensation dehumidifiers portable
- Condensation dehumidifiers & dryers stationary
- Dehumidifiers for Swimming pools
- Dehumidifier for home and office use
- Commercial & Industrial Air Humidifier for Increasing Humidity
- Basement dehumidifiers
- Dehumidifier Calculation in Excel
- Multifunction data loggers by Graphtec, Japan
- Food Processing & HACCP Thermometer
- Data Center Temperature Monitoring
- Wireless Temperature Monitoring
- Infrared Thermal Imaging camera
- Temperature Sensor
- Thermocouple
- High Temperature Industrial Data Logger
- Environment Monitoring
- Agricultural Monitoring
- Services
- Associates
- Blog
- FAQ – Temperature Mapping and Monitoring
- Get A Quote
- About Us
- Downloads
data-logger-printer-report-graph
‹ Return to Temperature Data Logger with Printer
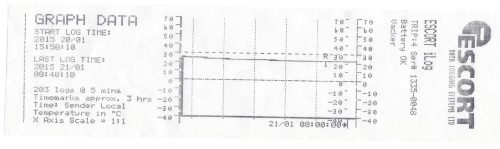
Graph printed by data logger with printer
This is the sample graph printed by the portable temperature recorder with printer.
This is the graph of the data recorded by the data logger and printed by the printer. The higher and lower limits programmed in the data logger are shown in dotted lines as 0 and 30°C. For a quick view of the temperature recording of the temperature sensitive goods, this graph can be printed by the driver and handed over to the customer before delivering the goods.
Please see the complete details of data logger with printer
Vacker Group supplies all types of data loggers in United Arab Emirates, Qatar, Kuwait, Kingdom of Saudi Arabia, Bahrain, Jordan, Iraq and Oman.
Also VackerAfrica supplies these in African countries covering Nigeria, Djibouti, Tanzania, Kenya, Cameroon, Ethiopia etc.
Vacker LLC
Thermal Division
306, RKM Building
Deira, Dubai
United Arab Emirates
Tel: +971 42 66 11 44
email : sales@vackerglobal.com
Leave a Reply