


A temperature mapping study also known as a Thermal mapping study refers to the process of examining the temperature distribution in a warehouse, cold room, refrigerator, van, or reefer truck. This is done to determine whether the temperature inside the facility is always maintained within the appropriate range under various real-life conditions.
It is the process of validating / qualifying equipment and storage facilities to prove that they will create and maintain the temperatures they are designed for.
Temperature mapping study and validation are mainly applicable to the pharmaceutical industry and food/FMCG industry. It helps us to analyze and ensure the uniformity of temperature distribution across all areas of the warehouse, storage rooms, etc.
What is the difference between Temperature Mapping Study and Validation?
Temperature Mapping study provides a detailed analysis report for your enclosed area about the permitted distribution of temperature and humidity. The mapping study does not check various criteria such as SOP, whether installation has been done correctly, whether the machines are working as per the design, whether written procedures are maintained, whether these written procedures are sufficient etc. All such parameters are covered in a temperature qualification study.
A temperature qualification study incudes mapping study, but not vice versa.
Temperature qualification study is a very detailed sequence of tests and analysis to ensure that the asset is designed and installed in such a way that it can maintain the desired temperature. After these series of test and verification the asset is certified to be qualified for achieving and maintaining the desired levels of temperature and humidity levels.
A qualification study is considered to more of international acceptance. Validation of Electronic recording systems is carried out as per 21 CFR part11 process. Accredited third parties must certify the entire process and only then the certification process will be complete.
We are associated with Cryopak, the USA for providing certification for clients in the Middle East & African region.
What is 21 CFR Part 11?
In general terms, this stipulates that all manufacturers and distributors of medicines, vaccines, and related machinery should implement control measures and audits across various segments of the manufacture and distribution.
For life sciences, this refers to the recording of various critical data through all stages of manufacture, storage, and distribution of goods so that all recorded data is accurate.
Also please see our detailed article on the same: What is 21 CFR Part 11?
Temperature & Humidity Mapping Study
For certain assets, you need to maintain humidity within permitted levels. e.g. DHA, Dubai specifies that warehouses storing medicines should maintain humidity below 65% RH. In this case, we must test the distribution of humidity also along with the temperature. We call this study a Temperature & Humidity Mapping study.
The methodology for a temperature and humidity mapping study is the same as that for a temperature mapping study. However, in this case, the humidity will also be recorded for the same duration and will be analyzed. The settings of the dehumidifiers that are already installed are recorded so that the results can be compared to the expected ones. Humidity is also important for many storage areas and needs to be considered.
The temperature study is carried out at least in two climatic conditions i.e., Summer and winter. This will provide a detailed analysis of the area across various climatic conditions.
Necessity of Temperature Mapping study
Performing a temperature mapping study is necessary to ensure that all areas of your asset are at the same temperature as per the optimum range required.
Typically, temperature mapping study is required for the following type of assets:
- Warehouses where a temperature between 15°C to 25°C is to be maintained.
- Cold Room where normally a temperature between 2°C to 4°C is to be maintained.
- Walk-in Chillers or Freezers which usually have a temperature below zero Degree up to -40°C.
- Refrigerators which store medicines normally between 2°C to 8°C.
- Cold Storage used for storing food which might have different temperature ranges.
- Autoclaves which maintain specific temperature ranges.
- Refrigerated Vehicle, Van & Reefers where a temperature range such as 2°C to 8°C for medicine transportation is to be maintained.
- Thermal insulated passive boxes where temperature for a certain duration is to be maintained.
- Active refrigerated boxes which are small refrigerators.
How does a temperature mapping study work?
The principle of temperature mapping is to record the cold compartment’s temperature in a variety of conditions. In accordance with the asset’s nature, data will be recorded for a few days or weeks. Various temperature data loggers will be placed at different heights within the testing area to record continuous data. The location of data loggers will be marked in a 3D drawing and will become part of the report.
Depending on the nature of the property, the following conditions will be tested: 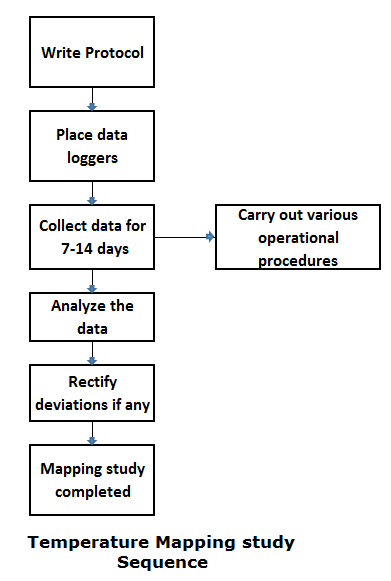
- An analysis of the distribution of temperature when no loads are present is conducted under empty conditions.
- An analysis of the distribution when the area is loaded to 60% of its capacity is conducted under 60% loaded conditions.
- An analysis of the distribution is conducted under 100% loaded conditions to determine how the area will perform when it is fully loaded.
- Door opening test to understand the effects on temperature during and after a door opening.
- An analysis of the effects of a power failure is performed by a power failure test.
- Test to determine how long it takes for the temperature inside the area to stabilize.
- Recovery test to check the time taken for temperature recovery after a door opening.
All operations like loading, unloading, forklift movement, etc. will happen as normal and such actions will be manually or digitally recorded to the extent possible. All collected data will be analyzed and plotted as a graph to analyze the temperature uniformity across the entire area. Any abnormal variations if found will also be compared with the real-time operations that happened at those specified times. Hot spots and cold spots will be identified in this study and corrective actions will be recommended.
Hot spots and cold spots
Hot spots and cold spots in the area are determined because of the temperature mapping study. As the name indicates, a hot spot means the hottest point inside the area.
The cold spot is the coldest recorded point. For example, in a warehouse after identifying the hot spot and cold spot, these points are to be continuously monitored using real-time temperature monitoring systems.
Results of the Temperature Mapping

Apart from certification, various recommendations will also be suggested as a part of the report such as:
- Are there any hot spots in the enclosed area? Are they rectifiable? If not, the area needs to be isolated so that sensitive items are not stored in that area.
- If power fails, how long the area is safe for the stored goods? This testing would help the customer to take the required actions in case of a power failure.
- We can decide the location for placing Sensors or recording instruments for continuous monitoring.
- How many people and machinery can occupy the area simultaneously?
- Any difference in behavior during Summer and Winter?
Related Articles:
- What is the difference between Qualification and validation in cold chain?
- Validation protocol for wireless temperature monitoring
- Difference between Temperature Mapping Study & Qualification